
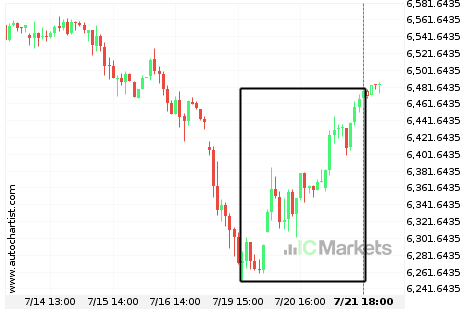
El France 40 Index está en dirección up
El France 40 Index ha experimentado un excepcional movimiento ascendente de un 3,21% de 6.272,24 a 6.475,93 en 3 días.
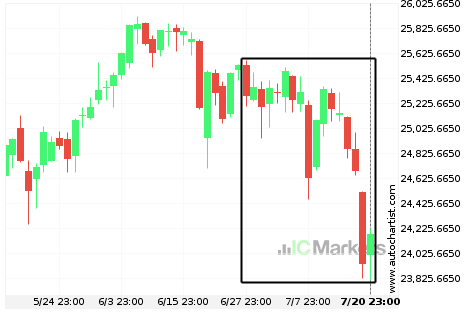
El Italy 40 Index experimentó un movimiento excepcional
Para aquellos de ustedes que no creen en las tendencias, esta puede ser una oportunidad para aprovechar un excepcional movimiento de un 4,36% de Italy 40 Index. Este movimiento está ocurriendo desde hace 24 días. Por otro lado, para aquellos que siguen las tendencias, deben considerar aprovecharse de esta.
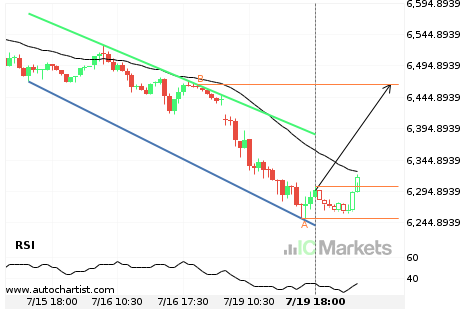
El France 40 Index se aproxima a la resistencia de un Canal bajista
El France 40 Index se está acercando a la línea de resistencia de un Canal bajista. Ha llegado a esta línea en numerosas ocasiones durante los últimos 5 días. Si vuelve a probarla de nuevo, debería hacerlo en las próximas 6 horas.
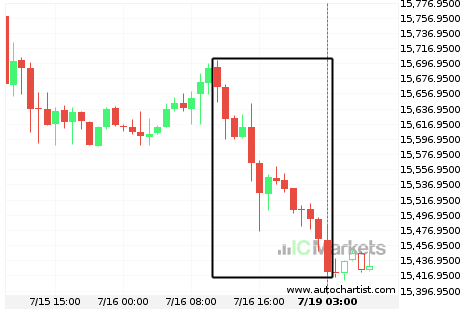
El Germany 30 Index está en dirección down
El Germany 30 Index ha experimentado un excepcional movimiento descendente de un 1,56% de 15.691,8 a 15.421,5 en 3 días.
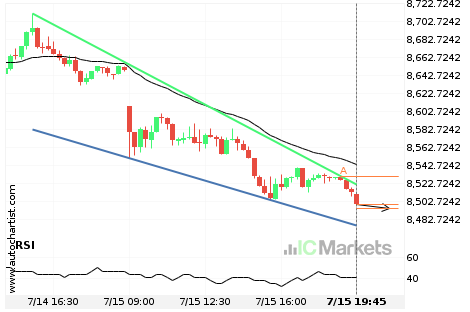
El Spain 35 Index se aproxima a el soporte de un Cuña descendente
El Spain 35 Index se está acercando a la línea de soporte de un Cuña descendente. Ha llegado a esta línea en numerosas ocasiones durante los últimos 2 días. Si vuelve a probarla de nuevo, debería hacerlo en las próximas 5 horas.
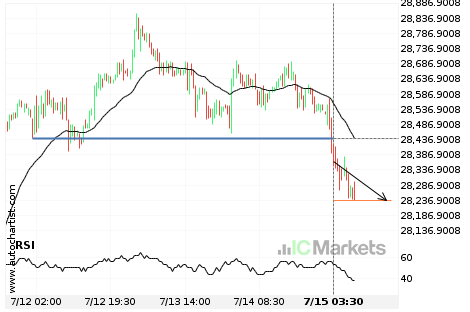
¿Deberíamos esperar una tendencia bajista en el Japan 225 Index?
La irrupción del Japan 225 Index a través de la línea de precio de 28440.0000 es la ruptura de un importante precio psicológico que se ha probado en numerosas ocasiones durante el pasado. Si esta irrupción persiste, esperamos que el precio del Japan 225 Index pruebe el nivel de 28235.4004 en las próximas 13 horas. […]
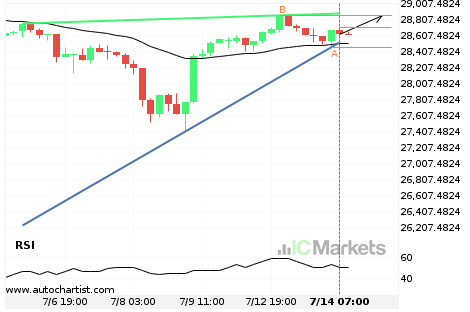
¿Tendrá el Japan 225 Index suficiente impulso como para irrumpir la resistencia?
El Japan 225 Index se dirige hacia la línea de resistencia de un Triángulo ascendente y puede alcanzar este punto en las próximas 2 días. Ha probado esta línea ya en numerosas ocasiones en el pasado, y esta vez no tendría porqué ser diferente y terminar con una recuperación en lugar de una irrupción. Si […]
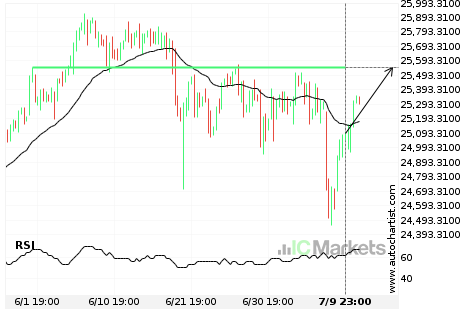
O bien, una inminente recuperación o una ruptura del Italy 40 Index
El Italy 40 Index avanza hacia la línea de 25547.3008. Si este movimiento se mantiene, esperamos que el precio del Italy 40 Index pruebe el nivel de 25547.3008 en las próximas 2 días. Pero no se apresure a la hora de operar, porque el par ha probado esta línea en numerosas ocasiones durante el pasado, […]

O bien, una inminente recuperación o una ruptura del Italy 40 Index
El Italy 40 Index avanza hacia la línea de 25518.1992. Si este movimiento se mantiene, esperamos que el precio del Italy 40 Index pruebe el nivel de 25518.1992 en las próximas 2 días. Pero no se apresure a la hora de operar, porque el par ha probado esta línea en numerosas ocasiones durante el pasado, […]
El EU Stocks 50 Index experimentó un movimiento excepcional
Para aquellos de ustedes que no creen en las tendencias, esta puede ser una oportunidad para aprovechar un excepcional movimiento de un 2,75% de EU Stocks 50 Index. Este movimiento está ocurriendo desde hace 21 días. Por otro lado, para aquellos que siguen las tendencias, deben considerar aprovecharse de esta.